
The two lowest sections on Home ↗ answer two different questions: where contacts get lost, and what came out of it in the end.
Conversion funnel · Last 30 days
Four cards, each with a percentage, the transition it describes, and the basis below it:
| Card | Transition | Basis |
|---|---|---|
| Lead conversion | Lead → meeting booked | {num} of {den} leads |
| Show rate | Meeting → happened | {num} of {den} meetings |
| Pipeline conversion | Discovery → offer | {num} of {den} discoveries |
| Deal conversion | Offer → closed won | {num} of {den} offers |
All four cover the past 30 days. At the bottom right sits the change in percentage points, for example +8 pp, compared with the 30 days before that.
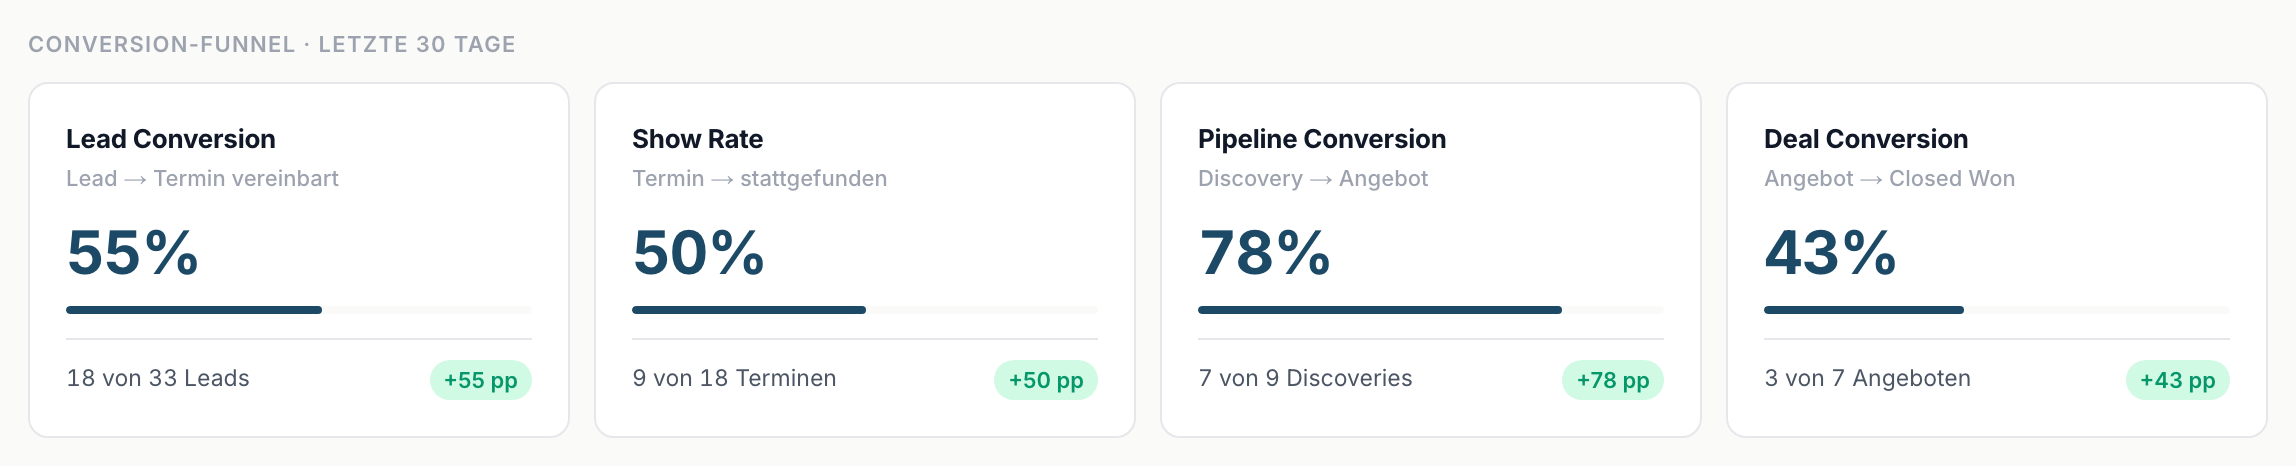
Percentage points, not percent. Going from 20 to 28 percent is eight points, not a 40 percent increase. That is deliberate, because only then are two rates directly comparable.
Every card is clickable and opens the matching records from the past 30 days.
How the show rate is calculated
- It counts meetings from the past 30 days up to and including yesterday (German time). Today's and future meetings don't count yet.
- Only meetings with a settled outcome count: happened (Discovery done, or a deal was created) or Discovery failed. If the meeting date is missing, you can add it on the lead page, and the meeting counts from then on.
- If a past meeting is still on Discovery scheduled, it counts once you update the stage.
- Leads set to Lead lost after a completed meeting still count as happened.
- The comparison with the previous period only appears once that period has at least 3 meetings. Clicking the card shows exactly the meetings counted.
Where you start
Find the lowest of the four numbers. That is where you lose the most.
- Low Lead conversion: contacts do not turn into meetings. Usually a question of the outreach.
- Low Show rate: meetings get booked but not held. A reminder shortly beforehand helps.
- Low Pipeline conversion: no offer follows the meeting. Usually the next step on the lead is missing.
- Low Deal conversion: offers are not accepted. A question of price, timing or follow-up.
Business outcome
Four cards with monthly figures:
- Sales cycle with the note Ø lead → closed won. The average number of days from creating a lead to the won deal, calculated across the deals won in the past 30 days. Next to it, the previous month for comparison.
- Closed won with the note This month ({month}). The sum of the deals won in this calendar month, with the previous month beside it.
- New customers, also for the current month. The number of deals won.
- Total customers with the note Active customer base. All deals ever won, plus +{count} in 90 days.
Two things to keep in mind
- Closed won and New customers drop to zero at the turn of the month. On the first of a month that is not lost data, it is the new period.
- For the sales cycle, less is better. A rising value is therefore flagged as a decline, even though the number got bigger.
When the numbers do not line up
The Conversion funnel works over 30 days, Business outcome over calendar months. At the beginning and in the middle of a month those periods do not overlap. Both sections can be right at the same time and still point in different directions.
And as everywhere on Home: with the Sales role you only see your own leads and deals.